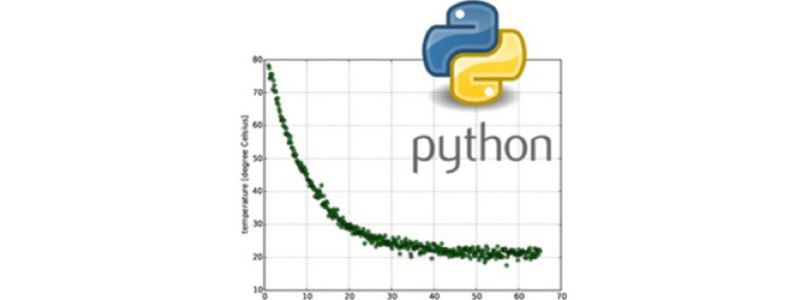
data visualization
Events
IMPRS UFAST Focus Course. Introduction to Programming with Python for Computational Science
Lecturer: Hans Fangohr
Hands-On exercises: Hans Fangohr, Henning Glawe and Heiko Appel
The course has been designed for scientists and engineers to teach the practical programming skills that are relevant for modern computational science. The module does not assume prior programming knowledge of participants. The module uses hands-on activities for all participants to exercise and experiment with the taught material. The material covers a wide spectrum of skills that are advantageous for scientists who need to handle data - be it from experiment or simulation – and provides a basis for self learning or directed learning of more specialized topics at a later stage.
Topics include:
- Introduction to data types in Python
- Control flow
- Name spaces
- Input/Output
- Higher order functions
- Main programming paradigms
- Important Python modules for computational science (numpy, scipy, pandas, sympy)
- Data visualization with matplotlib
Informatik-Kolloquium: Interactive, feature-based 3-D visualization for rapid exploration of gridded atmospheric data
Visualization is an important and ubiquitous tool in the daily work of atmospheric researchers and weather forecasters to analyse data from simulations and observations. In this talk, I will present recent and ongoing work we are conducting at the Universität Hamburg’s Visual Data Analysis Group with respect to interactive 3-D visualization and feature detection using gridded atmospheric data. This includes methods for detection and interactive visual analysis of 3-D atmospheric fronts, as well as interactive 3-D analysis of simulated clouds and other volumetric data. Our methods are integrated into “Met.3D”, our open-source research software that makes novel interactive, 3-D, feature-based, and ensemble visualization techniques accessible to the meteorological community (https://met3d.wavestoweather.de). Since its first public release in 2015, Met.3D has been advanced within the German research projects “Waves to Weather (W2W)” and “Climate, Climatic Change, and Society (CLICCS)” and has evolved into a feature-rich visual analysis tool facilitating rapid exploration of gridded atmospheric data.
Speaker: Dr. Marc Rautenhaus
Bio:
Marc Rautenhaus leads the Visual Data Analysis Group at the Regional Computing Centre of Universität Hamburg. His research interests lie at the intersection of visual computing and weather and climate research, focussing on interactive 3-D visualization, feature detection, weather forecasting, and research software development of the meteorological interactive 3-D ensemble visualization framework Met.3D. He holds a master’s degree in Atmospheric Science from the University of British Columbia, Canada, and a PhD in Computer Science from the Technical University of Munich. Previous posts include researcher/postdoc positions at the German Aerospace Centre (DLR) and the Technical University of Munich.
Institution
- Computer Networks UHH
Python for Computational Science part 1
Lecturer: Hans Fangohr
Python for Computational Science Part 1
The course has been designed for researchers to learn practical programming skills that are relevant for use of data processing, data science and computation in domain specific contexts. The module does not assume prior programming knowledge of participants. The module uses hands-on activities for all participants to exercise and experiment with the taught material. The course introduces skills that are advantageous for data handling - be it from experiment or simulation – and provides a basis for self learning or directed learning of more specialised topics at a later stage.
Part 2 of the course provides a deeper look into Python and introduces a wider range of libraries.
Anticipated topics:
- Introduction to Python
- Data types & structures
- Control flow
- Functions
- PEP8
- Name spaces
- File Input/Output
- Numpy
- matplotlib
- Spyder
- IPython
- Jupyter
Details here
Register here for part 1 (deadline is Sunday 26 January 2025)
Python for Computational Science part 2
Lecturer: Hans Fangohr
Building on Part 1, this course covers additional aspects:
- advanced Python (including list comprehension, names and side effects, functional programming, object orientation, performance)
- additional libraries such as scipy, pandas, and sympy
- research software engineering and testing, and
- selected numerical methods and application examples with focus on natural science and engineering problems.
Aspects (1) to (3) are covered in the beginning of the course. Part (4) is delivered at the end of the week, and can be omitted if not relevant to the participant.
Anticipated topics:
- Higher order functions
- programming paradigms
- scipy, pandas, sympy
- Research software engineering practices, in particular testing
- Python package installation
- interpolation, root finding, curve fitting
- Optimisation, computing derivatives
- Integration of ordinary differential equations
Details here
Register here for part 1 (deadline is Sunday 26 January 2025)

Talk by Alexandra Diehl on Weather Forecast Communication and Analysis
We are excited to announce a guest talk by Alexandra Diehl from the University of Zurich, who will present her latest research on the visualization and communication of weather forecasts. Alexandra is a senior researcher and lecturer in the Multimedia and Visualization group at UZH's Department of Computer Science. Her work focuses on efficient analysis, decision-making, and communication of high-impact weather events (HIWE) and their associated risks.
Talk Title: Visualization Research for Weather Forecast Communication and Analysis
Abstract: This talk will cover Alexandra's recent contributions to developing efficient visualization tools for analyzing and communicating weather forecasts and characterizing HIWEs. Additionally, she will discuss her current efforts in citizen data analysis and the challenges of effectively communicating severe weather events through participatory citizen science.
Speaker Bio: Alexandra Diehl holds a Ph.D. in Computer Science from the University of Buenos Aires and has extensive experience in data visualization, visual analytics, and geographic information systems. She has been a postdoctoral researcher in the Data Visualization and Analysis Group at the University of Konstanz and currently works with Prof. Dr. Renato Pajarola's group at UZH.
We look forward to seeing many of you at this insightful talk.
Universität Hamburg
Adeline Scharfenberg